Bug reports with the context developers need
“The button doesn’t work” leaves a developer guessing. Tuix connects the report to the button, the page and the context captured while the reporter is using it.
14-day trial on a paid web plan. No card required.
Without contextThe button doesn’t work.
With Tuix
- Report
- Save changes leaves the old payment note.
- Element
- button[data-testid="save-note"]
- Environment
- Staging · Chrome · viewport 1280 × 800
- Expected
- The edited payment note persists after reload.
- Actual
- The old note returns after reload.
- Available diagnostic
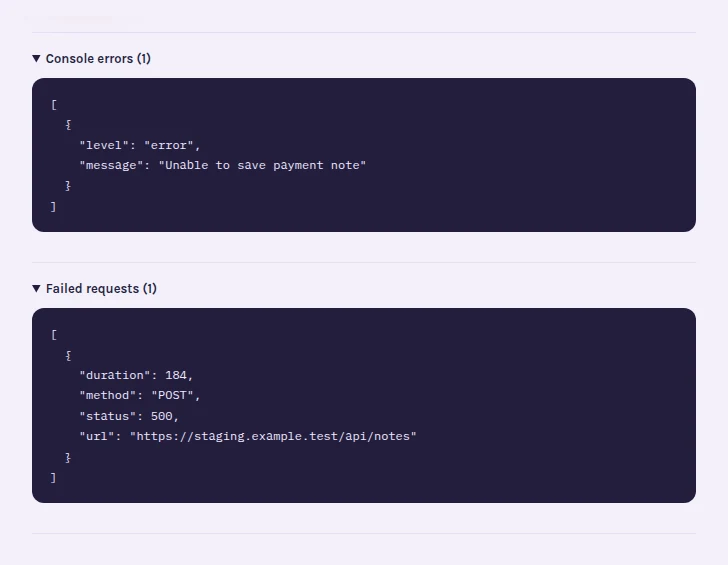
- POST /api/notes → 500
From a vague message to an inspectable report
In an email, “the button doesn’t work” may arrive without a URL, a browser or even the name of the button. An attached screenshot shows the symptom, but the developer still has to find the element and ask what happened before it failed.
With Tuix, the reporter selects the affected element and describes the problem on the website. The report keeps the page address, element locators and browser context together. A screenshot can show the selected area; the reporter can review or remove it before sending. Screenshots depend on project settings and successful capture.
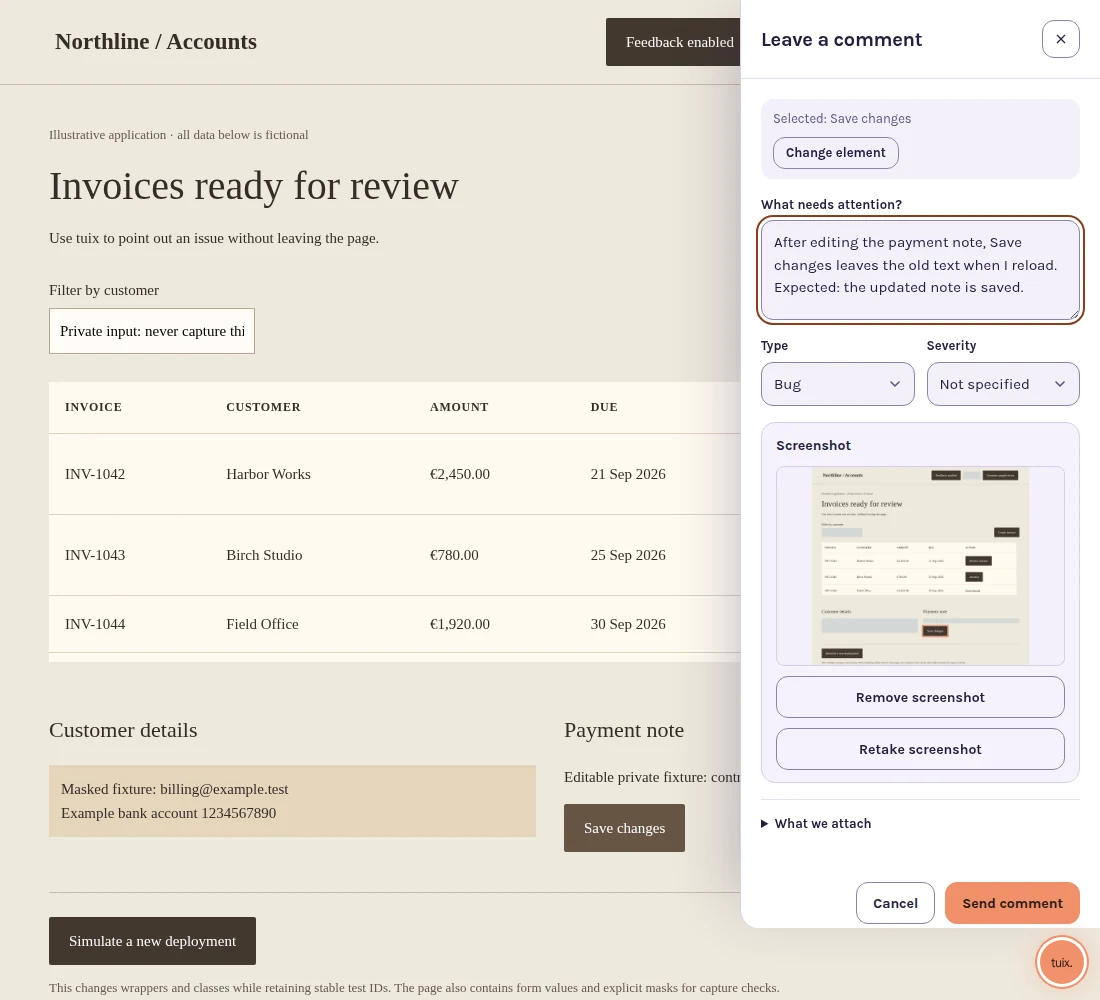
Report, investigate, reply, verify
- Open Tuix on an integrated website and select the broken component.
- Write what happened, what you expected and the steps that led there.
- Review the attached context and send the report.
- The developer reads the report and replies in its conversation.
- After implementing and deploying the change, the team makes the fix ready for review.
- The reporter returns to the page and checks whether the original problem is resolved.
The reporter uses the identity provided by the host application. This is a review workflow for identified people, not an anonymous feedback form.
Screenshots explain appearance; diagnostics help investigation
Tuix can collect console errors and warnings and failed fetch or XMLHttpRequest metadata while capture is active. A failed request records details such as method, sanitized address, status and duration. It does not capture request or response bodies or headers. Project settings can disable or filter capture, and diagnostics are visible only to authorized people.
Open the widget before reproducing a problem if you need fresh diagnostic context. No console entry is proof that the application is working, and an error beside a report is a clue, not a diagnosis.
Keep the conversation attached to the interface
For the failed save above, the developer can ask which invoice and payment note were used, investigate the failed request and share the fix in the same report. The reporter edits the note again on staging, saves it and reloads the invoice to check persistence. A screenshot documents what was seen; a successful retest establishes whether the interaction works.
Use QA review workflows for environment and regression checks, or client website reviews when the person confirming the change is your client. Compare plans before inviting your team.
Use the reproducible bug report checklist to separate reproduction steps, expected behavior and diagnostic clues.
Turn a vague bug report into evidence.
Give your developer the affected element, reproduction steps and captured context. Then check the deployed fix on the original page.